Gamma-ray bursts (GRBs) have been an active area of research since their serendipitous discovery by NASA's Vela satellites in the late 1960s. The most luminous events since the Big Bang, GRBs are theorized to occur during the deaths of massive stars (core-collapse supernovae) or through the merging of compact objects (neutron stars, block holes). The physics taking place in these extreme environments remains a subject of debate but improved observations of these objects, particularly at high energies, can help us understand the details of these events. In addition to better to a better understanding of GRBs, observations of GRBs at high energies can lead to improved constraints on Lorentz invariance violation and the extragalactic background light.
VERITAS has maintained an active program of GRB follow-up observations since 2006. During that time, VERITAS has taken observations of ~50 satellite-detected GRBs. Presented here are the results from VERITAS follow-up observations of 16 quality-selected GRBs detected by the Swift satellite. No significant flux of >100 GeV photons from any of these bursts is found and the upper limits on gamma-ray emission obtained with VERITAS are interpreted in the context of recent GRB observations by both the Fermi and Swift satellites.
Figure 1: Delay from the start of the burst to the beginning of VERITAS observations for all GRBs with VERITAS data. The open symbols correspond to observations that were delayed due to constraints such as the burst occurring during daylight or below the horizon. Filled symbols are unconstrained observation delays and are primarily determined by the time it takes the telescopes to slew to the burst. The sixteen stars correspond to the GRBs discussed in this paper. The shaded regions indicate the annual shutdown of the array due to the summer monsoons.
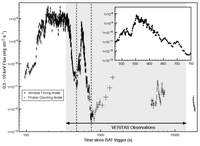
Figure 2: VERITAS observation window of GRB080310 superimposed on the Swift-XRT lightcurve (Evans et al. 2007, 2009). The inset shows the structure of the X-ray flare (dashed lines) and is the time window over which the search for VHE emission was performed. No significant excess of VHE gamma rays coincident with the X-ray flare (475 s < t − Ttrig < 750 s) was found.
Figure 3: Significance histograms of the 16 GRBs in this sample for both standard and soft source analyses. Included in the figures is the normalized Gaussian distribution of mean zero and variance one that the significance histograms should follow if no signal is present. The GRB significances are consistent with having been drawn from the aforementioned Gaussian distribution.
Figure 4: Significance histograms obtained from an analysis of the GRBs in the sample over timescales for which VERITAS is maximally sensitive to a burst with a t−1.5 power-law afterglow. Both standard and soft source analyses were performed. Included in the figures is the normalized Gaussian distribution of mean zero and variance one that the significance histograms should follow if no signal is present. The GRB significances are consistent with having been drawn from the aforementioned Gaussian distribution.

Figure 5: (a) EBL-corrected VERITAS integral fluence upper limits above 200 GeV, divided by the fluence measured by the Swift-BAT in the 15 – 350 keV energy band as a function of tmed as defined in the text. (b) A histogram of the ratio of the VERITAS integral fluence upper limit above 200 GeV, now integrated over the time period t − Ttrig > 300 s, to the Swift-BAT fluence. One burst, GRB080409 is omitted in this plot as the VERITAS upper limit on the fluence of this burst is eleven orders of magnitude above the fluence measured by the BAT.

Figure 6: Predicted VERITAS lightcurves for three of the four brightest Fermi-LAT GRBs. The fourth, GRB080916C had a redshift of nearly 4.4 and VHE emission is predicted to be too attenuated by the EBL to be detectable by VERITAS. The EBL model of Gilmore et al. (2009) is used to estimate the attenuation of the VHE γ-rays. The elevation of the burst with respect to VERITAS is chosen to be 70o and no intrinsic spectral cutoff of the high-energy emission is assumed. Each point signifies a detection of at least three standard deviations (σ) in that time bin.


