Historically, Imaging Atmospheric Cherenkov telescopes have been limited to observing on clear, moonless nights due to the fact that their photomultiplier tube (PMT) cameras are extremely sensitive to light and can be damaged when exposed to a bright sky. Since 2012, VERITAS has employed two new observing modes which allow the observatory to operate under bright moonlight. The first is a reduced high voltage (RHV) mode, where the voltages applied to the PMTs are reduced, lowering the current that passes through them and preventing damage. The second is the use of UV bandpass filters to reject the unwanted moonlight.
While observing in the RHV mode, VERITAS has detected the blazar 1ES 1727+502 in a flaring state; this triggered multiwavelength obserrvations by other experiments. The target was observed for several more days; observations transitioned from RHV to standard configuration as soon as the observing conditions allowed. This demonstrates the benefits of observing under moonlight; this flare (the first detection of variability from the object) would otherwise have gone unnoticed. The results of observations from the FLWO 48" telescope, Swift and Fermi satellites, and VERITAS data were modeled using a standard syncrotron-self-Compton emission model. The resulting fit parameters agree with the current paradigm of blazar emission.
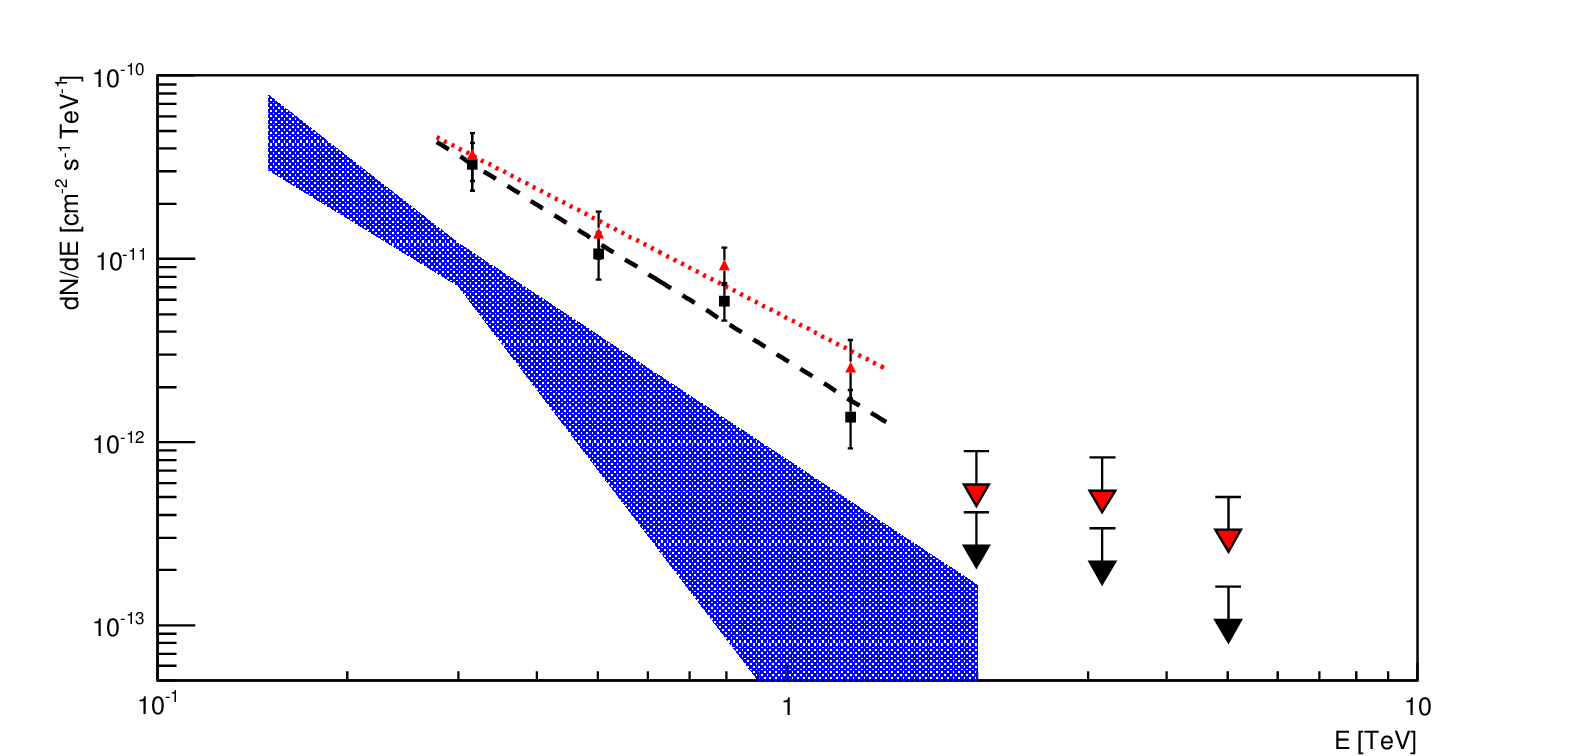
Figure 1: Spectrum for the complete 1ES 1727+502 dataset. Power-law fits to both the uncorrected (black, squares) and EBL-corrected (red, triangles) points are provided. The fitted values are given in the text. The blue shaded region represents the result from MAGIC (Aleksic et al. 2014). Note that the first upper limit is below the extrapolation of the fit. This may be indicative of a cutoff, however, the number of events in this bin is low (1 ON and 2 OFF events with α = 0.08 at 2 TeV), thus, it is also possible that this is simply a downward statistical fluctuation.

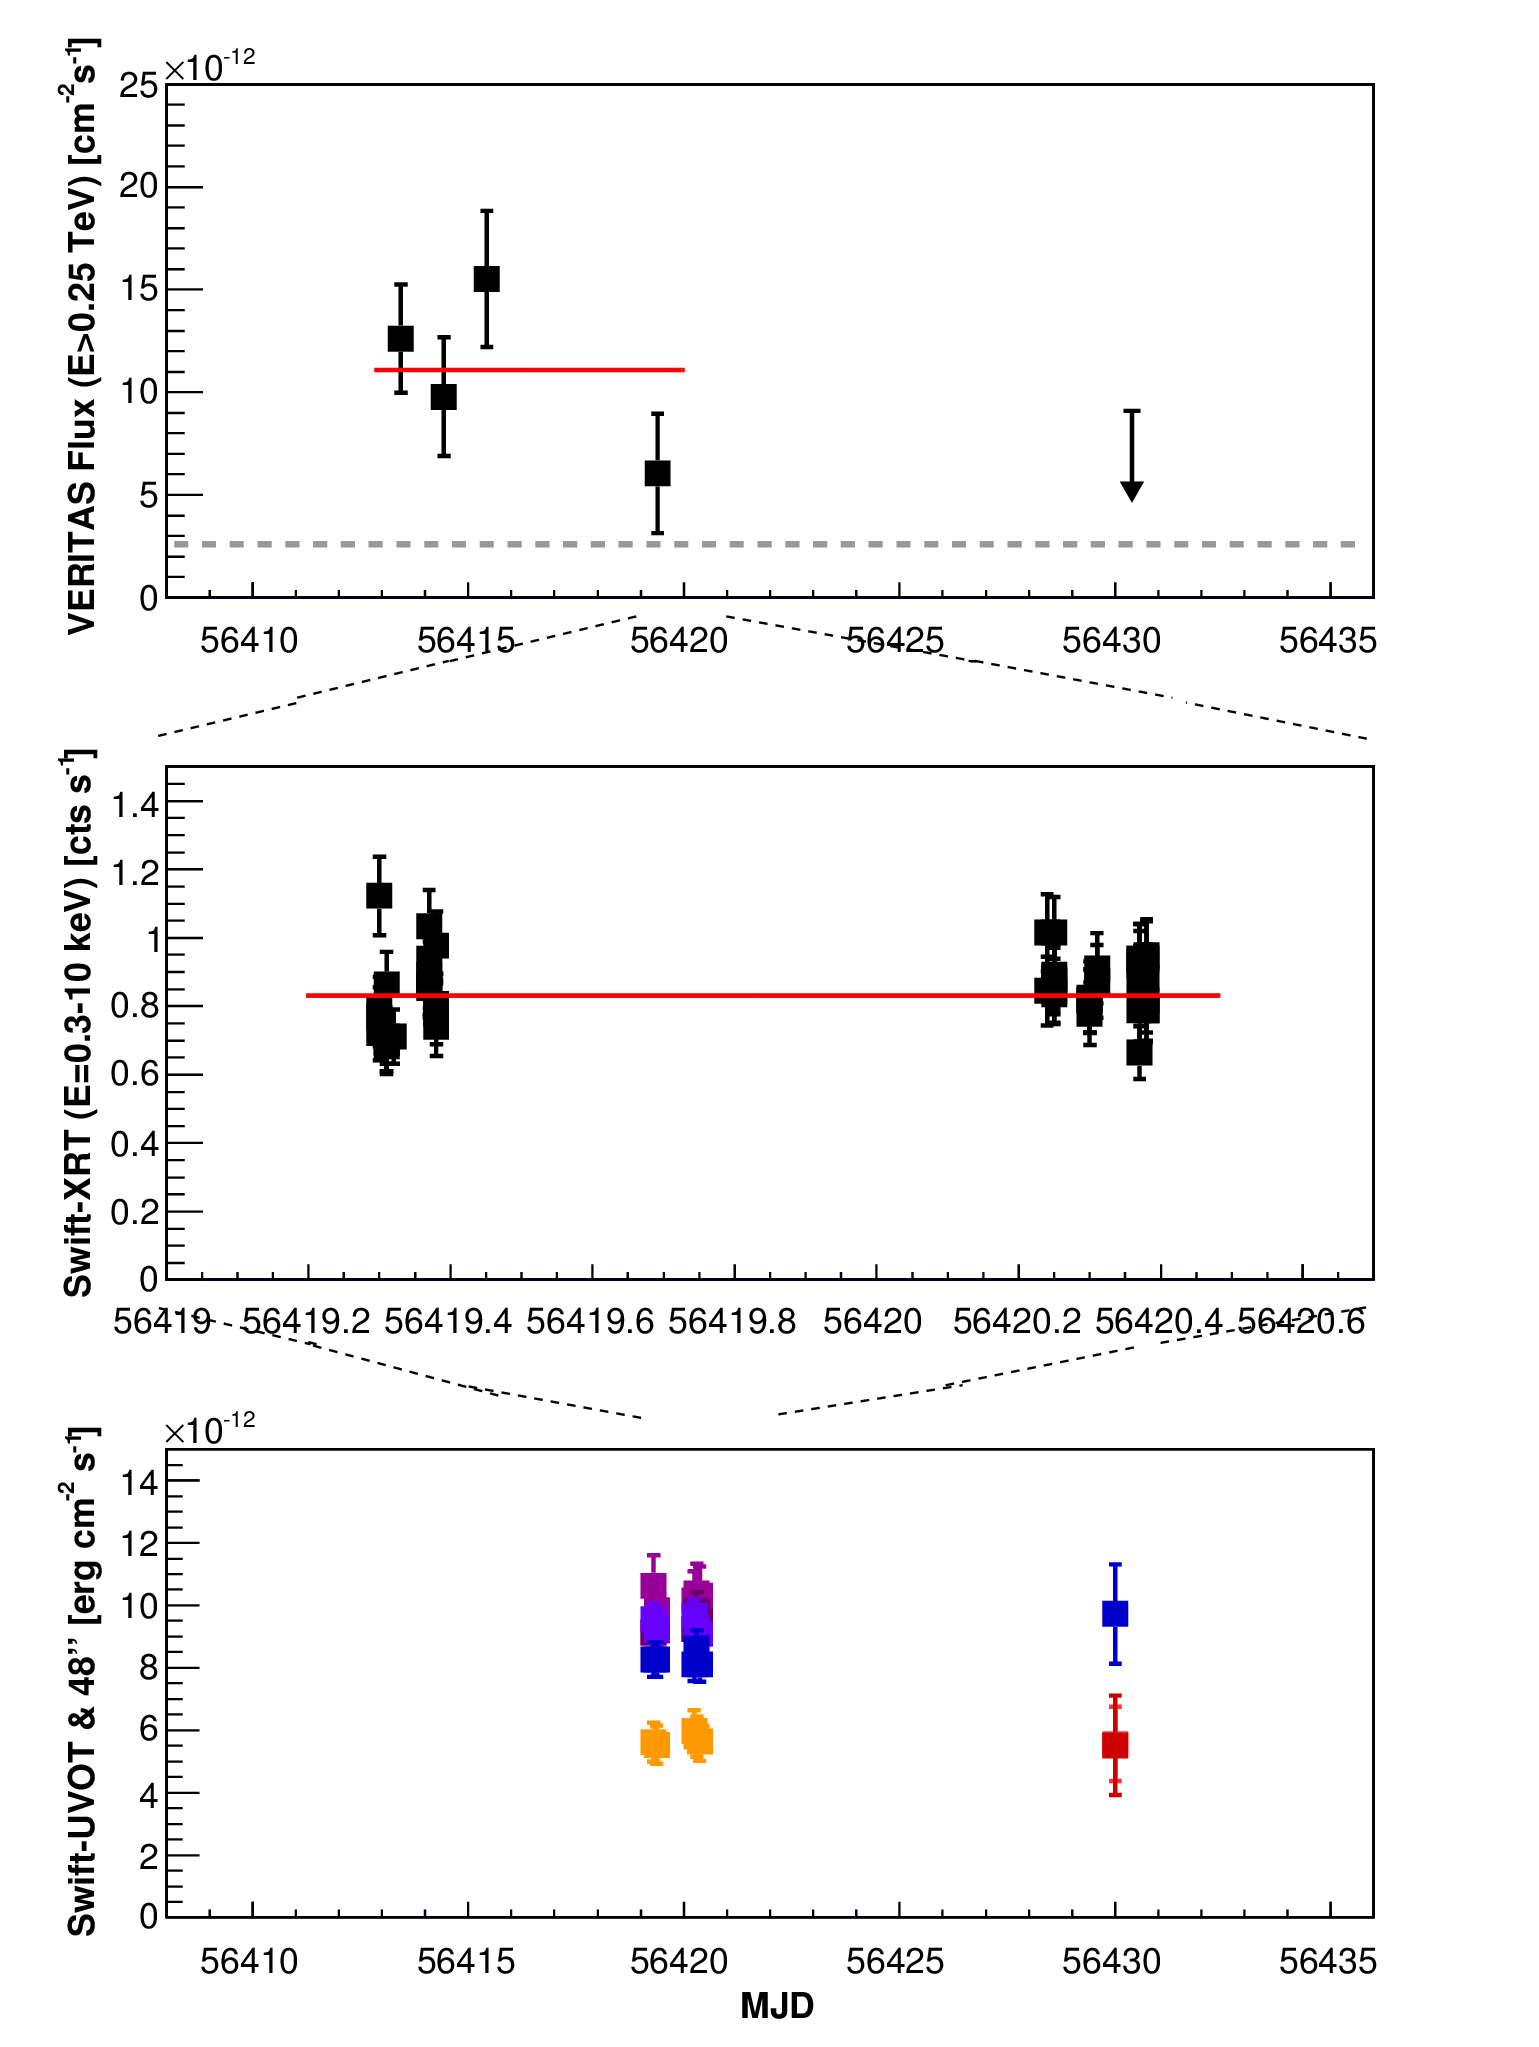
Figure 2: Light curve of 1ES 1727+502 during the May 2013 multiwavelength campaign. The time axis is in Modified Julian Days. For reference, MJD 56415 corresponds to May 3, 2013. Top panel: VERITAS flux light curve, measured above 250 GeV and in daily bins. The errors are statistical only, and the first two data points were taken in RHV mode. The red line corresponds to the average VERITAS flux, while the dotted black line corresponds to the archival VHE flux reported by MAGIC. Central panel: Swift-XRT light curve, expressed in counts per second above 0.3 keV. The red line corresponds to the average X-ray flux during this campaign. Note that in this panel the X-axis is zoomed on MJDs 56419 and 56420. Bottom panel: Swift-UVOT (on MJD 56419-20) and FLWO 48" (on MJD 56430) light curve, expressed as νFν. Data have been corrected for both Galactic absorption and host-galaxy contamination. Red points correspond to i’ and r’ filters (the two are almost superposed on MJD 56430), orange to V, blue to B, violet to U, magenta to the UVW1,UVW2 and UVM2.

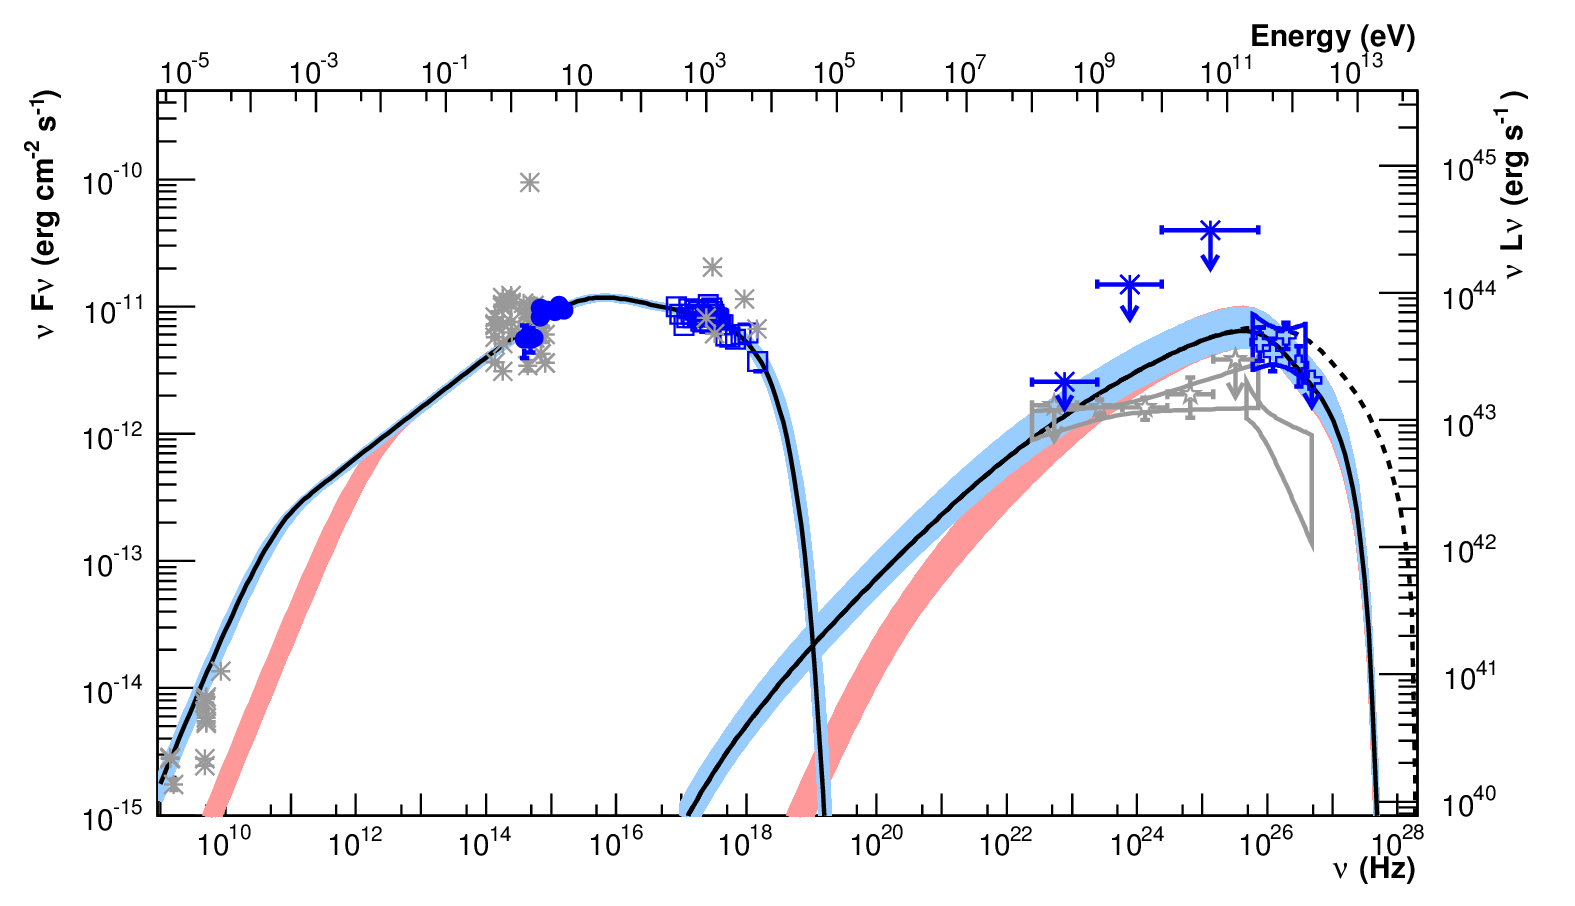
Figure 3: Quasi-simultaneous SED of 1ES 1727+502 (in blue; from low to high energies: FLWO 48", Swift-UVOT, Swift-XRT, Fermi-LAT and VERITAS). Archival data (from the NED, Fermi-LAT, and MAGIC) are included, and plotted in gray. The light-blue and pink curves represent the two sets of SSC models computed assuming γmin = 103 and 5×10³ (see Table 2 and Section 5). The black model represents the solution which minimizes the χ2 value. The black dotted line represents the same model without absorption on the EBL, estimated using the template by Franceschini et al. (2008). The luminosity (y-axis at the right) is computed assuming z = 0.055 and the cosmological values (flat universe, with H0 = 67.3 km s−1 Mpc−1 and Ωm = 0.315) estimated using the measurements made by the Planck satellite (Planck Collaboration et al. 2014).


