We use the Stellar Intensity Interferometry (SII) capabilities of VERITAS to obtain the first measured angular diameter of Merak (β Uma) at visual wavelengths. β UMa , an A1-type subgiant, is a member of the Ursa Major moving group, a group of stars with common velocity, composition and age, which have been tidally disrupted from an open stellar cluster. This paper presents current VERITAS-SII observation and analysis procedures to measure a limb-darkened angular diameter of 1.07 ± 0.04 (stat) ± 0.05 (sys) mas. The VERITAS-SII limb-darkened angular diameter yields an effective stellar temperature of 9700 ± 200 ± 200 K, consistent with ultraviolet spectrophotometry, and an age of 390 ± 29 ± 32 Myr, using MESA Isochrones and Stellar Tracks. This age is consistent with 408 ± 6 Myr from the CHARA Array angular diameter.
Figure 1: Telescope pair baseline coverage in the Fourier plane for the data points in Figure 4. Points indicate the baseline halfway into the run; lines indicate the range of baselines covered during a run, and gray tracks represent baselines near 100 m, treated as a single point with zero area in Figure 4.
Figure 2: A series of correlation functions taken during a two-hour run for telescopes 3 and 4. Plotted is g23,4 (τ, t) − 1, the correlation function defined in Equation 2 as function of time lag (τ ) and time-in-run (t) on the horizontal and vertical axes, respectively. The position in relative time of the small (∼ 10−6) but significant correlation peak varies during the run, as the geometric optical path delay (OPD) varies. A calculated OPD, based on knowledge of the star’s position, is indicated with a black curve, which has been offset from the data peak for clarity.
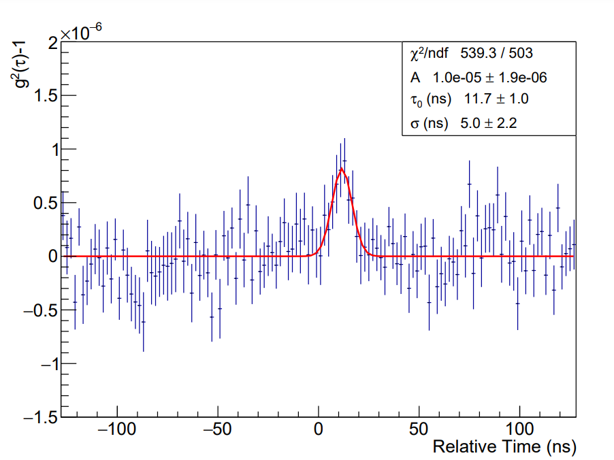
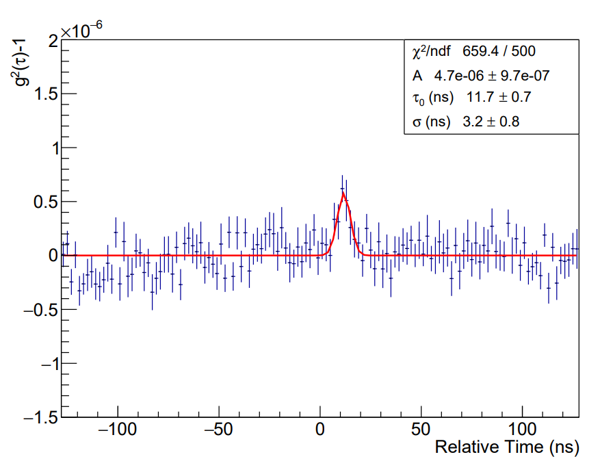
Figure 3: Time-averaged correlation functions ⟨g234(τ )⟩ from telescopes 3 and 4. Data from the left (right) panel was taken on December 16th, 2021 (February 11th, 2022). The projected baseline for the later run was larger than that for the earlier run, leading to a smaller correlation peak. The peaks are fit with a Gaussian functional form to quantify the correlation strength.
Figure 4: The measurements of the squared visibilities obtained as described in Subsection 4.4 are presented as a function of the corresponding projected baseline lengths for all pairs of telescopes. The red curve represents the fit of the uniform disk model to the selected data points indicated in blue color (see text for details). The dark grey points do not directly contribute to the red fit curve and their contribution is discussed in Subsection 4.4.

Figure 5: Red: The distribution of peak amplitudes returned by the peak-finding/fitting algorithm corresponding to the grey data-points on Figure 4 for baselines between 90-105 m. As with all data shown in Figure 4, the peak centers were within ±10 ns of nominal expectation. Blue: the same distribution, for the same runs, but using regions well outside the relative time delay τ region of any correlation signal. All peaks included here passed the width quality cut described in the text. A Kolmogorov-Smirnov test estimates the probability that the two distributions are consistent with the same parent is 99%. The off-peak distribution is renormalized to have the same area as the red curve in this figure, for proper comparison.

Figure 6: The measured VSII bandpass (in green) is shown in comparison to a normalized ELODIE archive (Moultaka et al. 2004) spectrum of β UMa (observation 20040309/0031, in black) and a normalized model spectrum (in blue) from the same model (mean effective temperature, Teff = 9720 K, mean surface gravity (in cgs units), log10(g/cm s−2 ) = 3.93, mass = 2.56 M⊙, v sin i = 46 km s−1 ) used to compute the synthetic visibilities. A cooler model spectrum (in red) with Teff = 9190 K is also shown.
Figure 7: Error contours for Chi-square minimization (equation 7) between the synthetic visibilities and the visibilities in Figure 4, with limb-darkened measurements from the CHARA (Boyajian et al. 2012) and Keck (Mennesson et al. 2014) arrays shown as shaded regions.
Figure 8: Model evolutionary tracks, from the MESA Isochrones and Stellar Tracks (MIST) web interpolator (Dotter 2016; Choi et al. 2016), through constraints on the effective temperature and luminosity. These constraints are provided by the VSII limb-darkened angular diameter, the bolometric flux, and the parallax, see Table 3. Model tracks have solar metallicities, with an initial rotational velocity set to 40% of the critical velocity.

Figure 9: Ultraviolet (UV) spectrophotometry from the International Ultraviolet Explorer (IUE), specifically from the Short Wavelength Prime (SWP) and Long Wavelength Redundant (LWR) cameras, both with the large aperture, are shown together with optical spectrophotometry from Glushneva et al. (1998). For clarity, in the UV, both the IUE and model fluxes are binned to 1 nm. In the optical, the data and model fluxes are binned to 5 nm. Three model spectral energy distributions using the effective temperature and limb-darkened angular diameters from this paper (blue), Boyajian et al. (2012) (green) and Jones et al. (2015) (red). These IUE data (never shown before in the literature) were retrieved from the MAST archive at 10.17909/jgah-0b96.


