In February 2017, the blazar OJ 287 underwent a period of intense multiwavelength activity, reaching a new historic peak in the soft X-ray (0.3-10 keV) band, as measured by Swift-XRT. This event coincides with a very-high-energy (VHE) gamma-ray outburst that led VERITAS to detect emission above 100 GeV, with a detection significance of 10σ. The time-averaged VHE gamma-ray spectrum was consistent with a soft power law and an integral flux corresponding to ≈2.4 % that of the Crab Nebula. Contemporaneous data from multiple instruments across the electromagnetic spectrum reveal complex flaring behavior, primarily in the soft X-ray and VHE bands.
To investigate the possible origin of such an event, our study focuses on three distinct activity states: before, during, and after the February 2017 peak. The spectral energy distributions during these periods suggest the presence of at least two non-thermal emission zones, with the more compact one responsible for the observed flare. Broadband modeling results and observations of a new radio knot in the jet of OJ 287 in 2017 are consistent with a flare originating from a strong recollimation shock outside the radio core.
Figure 1: Multiwavelength light curves of OJ 287. Panel (a) shows the VHE flux above 130 GeV obtained by VERITAS. Panel (b) shows the flux between 0.1 GeV and 300 GeV obtained by Fermi-LAT. Panel (c) shows the X-ray flux broken down into soft (0.3-1 keV), medium (1-3 keV) and hard (3-10 keV) energy bands. Panels (d) and (e) show the UV and optical observations taken by Swift-UVOT in the UVW1, UVM2 and UVW2, and U, B and V bands respectively. The shaded regions in blue, orange, and grey, correspond to the studied periods Low, Flare, and Post-Flare, respectively, defined in Section 2.1.
Figure 2: X-ray and Optical light curve of OJ 287. Panel a) shows the X-ray flux as described in Figure 1; Panel b) shows the B-band magnitude; Panel c) shows the V-band magnitude; Panel d) shows the I-band magnitude and Panel e) shows the R-band magnitude.
Figure 3: Optical polarization measurements OJ 287. The top panel shows the polarization percentage. The bottom panel shows the EVPA degree. See Section 3.2 text for details on annotations.
Figure 4: DCF analysis for soft X-ray flux compared with other X-ray-UVOT flux bands. The top panel shows (left to right) Soft, Moderate and Hard X-ray flux. The middle panel shows B, V and U. The bottom panel shows UVW1, UVM2 and UVW2. The dashed black line in each panel represents a time lag of zero days (no lag) between the two datasets. A negative time lag suggests a soft X-ray-led flare, while a positive one suggests a soft X-ray lag. The dotted blue, dot-dashed orange and dashed green lines represent the upper bound on the 1σ, 2σ- and 3σ-confidence intervals.
Figure 5: Linear correlation between VHE and Soft (0.3-1 keV) X-ray flux. 95% C.L. upper limits are plotted for VHE observations with an excess significance < 2σ, however they are included in the fit (see text). The red solid line corresponds to the best-fit linear correlation described by Equation 5, with results shown in Table 3 and the green dashed line shows the constant flux model.
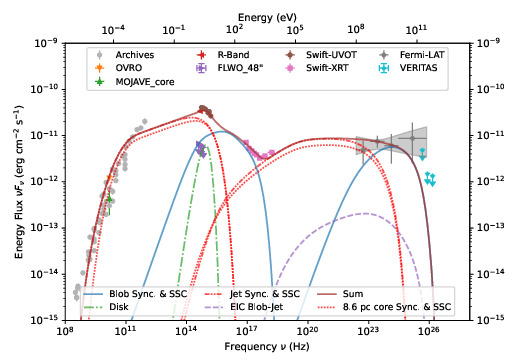
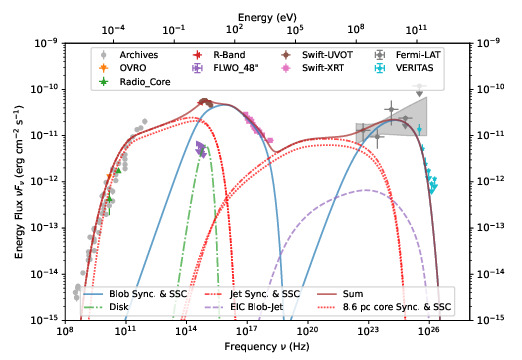
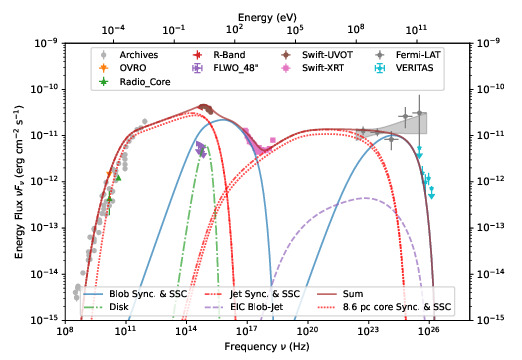
Figure 6: Broadband SEDs of OJ 287 Low, Flare, and Post-Flare activity states (left to right). The multi-zone radiative model Bjet is applied to the three activity states of the source. The γ-ray EBL absorption is taken into account considering the model of Franceschini & Rodighiero (2017). Archival radio data from various instruments and epochs are extracted with the “SSDC SED Builder” (Stratta et al. 2011).
Figure 7: Reduced χ2 of the γ-ray fitted SED for the three states of activity of OJ 287 according to the intrinsic distance of the blob from the SMBH (DBH). The models are set to the parameters shown in Table 4, keeping free only the DBH value. The domain above the orange dashed line represents the χ2red values that are rejected at > 95.4% C.L (2 sigma) against the best χ2red for the flaring state.


